Motivation
Many teams deploy LLM inference on mid-range, single-GPU nodes. We chose a single NVIDIA A10 as the test bed to reflect that reality: it is widely available, cost-sensitive, and memory-constrained compared with flagship datacenter GPUs. Under this constraint, the serving engine must deliver high throughput and low, predictable latency without relying on multi-GPU sharding.
Our goals were to:
- Identify an engine that maximizes throughput (requests/s and tokens/s) on a single A10.
- Minimize user-visible delay—time to first token (TTFT)—and keep tail latency (P95/P99) tight.
- Verify scaling under load (concurrency 1→64) to support bursty, multi-tenant traffic.
- Improve cost efficiency by reducing the number of replicas needed to meet SLOs and autoscaling targets.
We benchmarked Kolossal, vLLM, and Ollama under identical conditions on one A10 to inform engine selection for production LLM serving, where hardware is limited, latency matters, and capacity headroom must be predictable.
Result
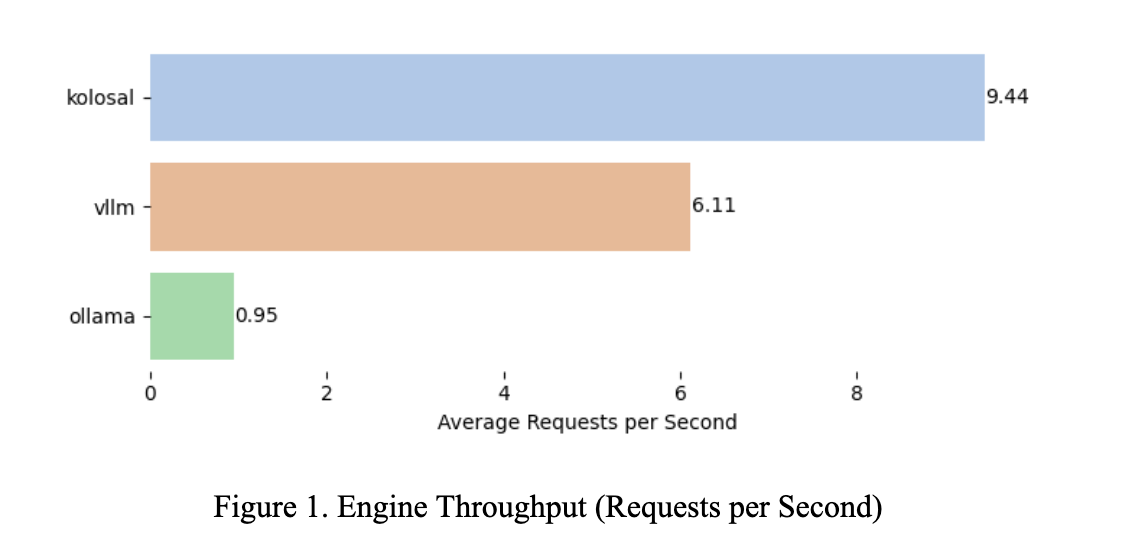
Kolosal achieved 9.44 requests per second (RPS), outperforming VLM at 6.11 and Ollama at 0.95. This is an absolute gain of +3.33 RPS over VLM and +8.49 RPS over Ollama, corresponding to 1.55× (+54.5%) faster than VLM and 9.94× (+893.7%) faster than Ollama. Under comparable test conditions, Kolosal provides the highest throughput and can handle more concurrent requests before saturation, making it the preferred option when maximizing RPS is the objective.
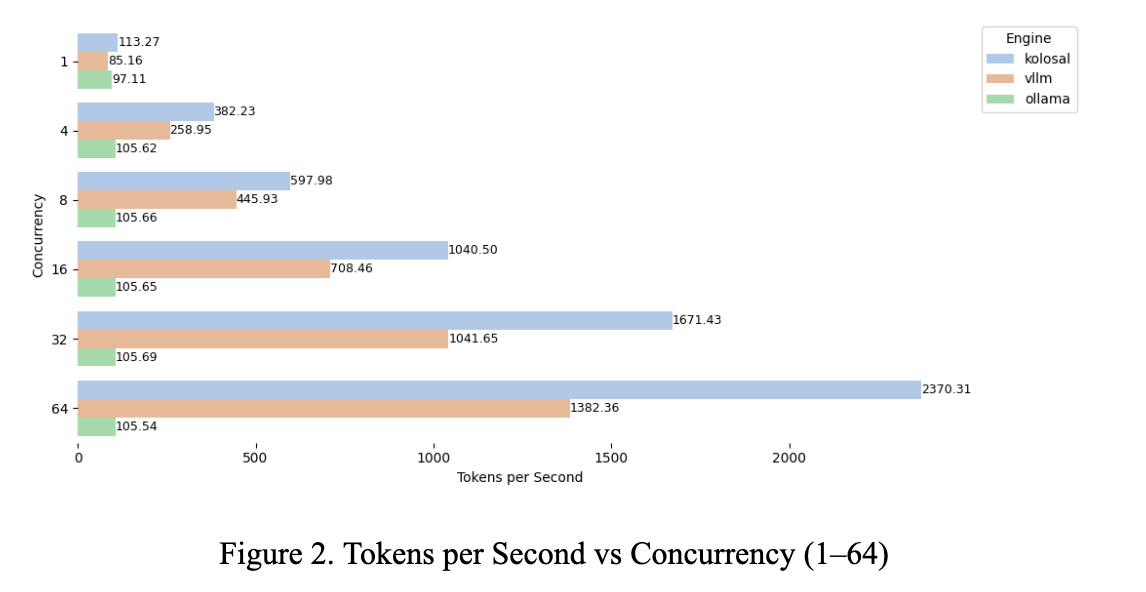
Across all tested concurrency levels from 1 to 64, Kolosal achieves 113.27 to 2,370.31 tokens per second, exceeding vLLM’s 85.16 to 1,382.36 and Ollama’s 97.11 to 105.54. On average, Kolosal sustains 1,029.29 tokens per second—about 70.48% higher than vLLM (603.75 tps) and 9.88 times higher than Ollama (104.21 tps). At a concurrency of 32, Kolosal achieves 1,671 tokens per second, which is 60.45% higher than vLLM and 15.81 times higher than Ollama; at 64, it delivers 2,370 tokens per second, 71.46% above vLLM and 22.46 times higher than Ollama. Ollama effectively plateaus near 105 tokens per second regardless of concurrency, while Kolosal continues to scale, providing the strongest throughput headroom of the three engines.
Ollama effectively plateaus near 105 tokens per second regardless of concurrency, while Kolosal continues to scale, providing the strongest throughput headroom of the three engines.
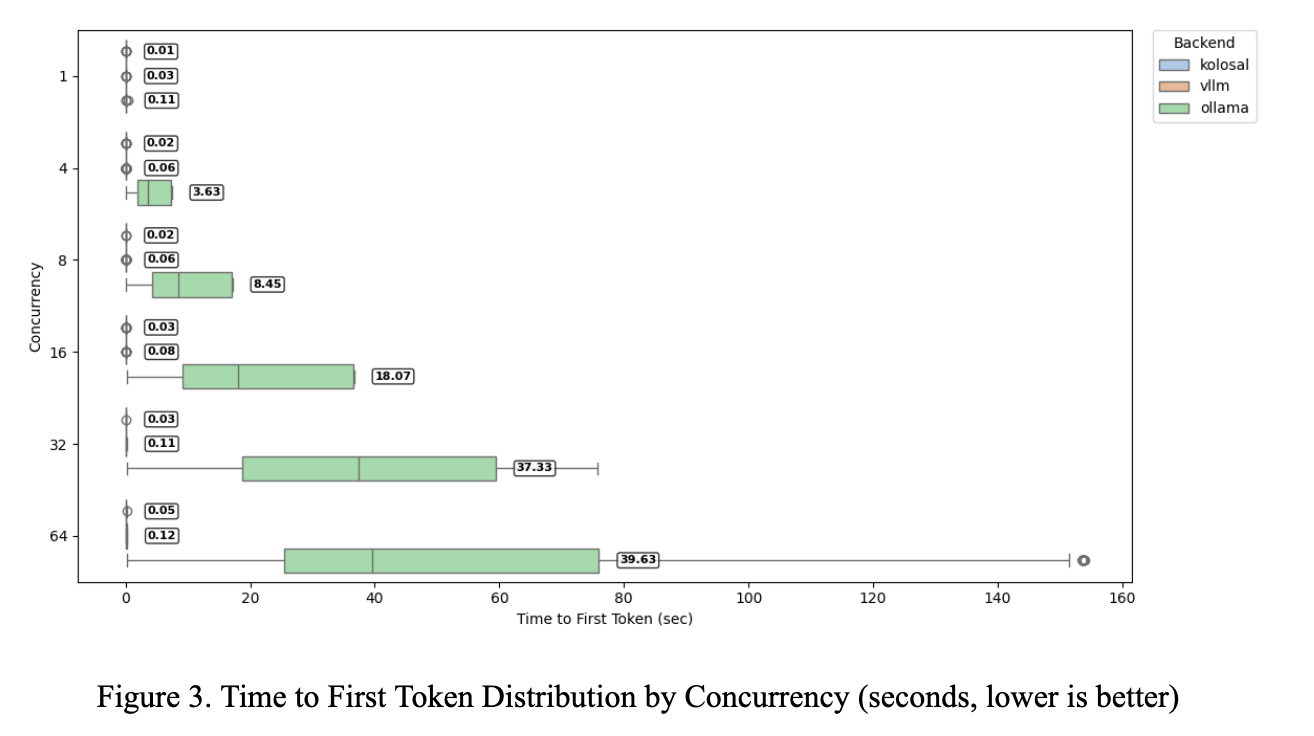
The TTFT box plot shows Kolosal near zero across all loads (0.01–0.07 s from concurrency 1–64). vLLM ranges 0.03–0.13 s. Ollama increases from ~0.11 s into tens of seconds with heavy tails, with mean TTFTs of ~3.6, 8.5, 18.1, 37.3, and 39.6 s at concurrencies 4, 8, 16, 32, and 64. At concurrency 32, Kolosal is 0.03 s versus vLLM’s 0.11 s (3.7× faster; −73%) and ~37.3 s for Ollama (~1,240× faster; ~99.9% lower). At 64, Kolosal is 0.07 s versus 0.13 s for vLLM (1.9× faster) and 60.81 s for Ollama (~870× faster). Variability is minimal for Kolosal and modest for vLLM; Ollama shows wide dispersion and outliers. Overall, Kolosal maintains lower and more stable TTFT as concurrency scales.
At 64, Kolosal is 0.07 s versus 0.13 s for vLLM (1.9× faster) and 60.81 s for Ollama (~870× faster). Variability is minimal for Kolosal and modest for vLLM; Ollama shows wide dispersion and outliers. Overall, Kolosal maintains lower and more stable TTFT as concurrency scales.
Kolosal has the lowest time to first token (TTFT) across all tested concurrency levels. From 1 to 64 concurrency, Kolosal stays within 0.01–0.07 s, compared with vLLM at 0.03–0.13 s and Ollama at 0.11–60.81 s. Relative to vLLM, Kolosal reduces TTFT by ~50–73% (≈2.0–3.7× faster); for example, at concurrency 32, it is 0.03 s vs 0.11 s (3.7× faster). Relative to Ollama, the gap is larger: ~11× faster at concurrency 1 and ~870× faster at concurrency 64. Net result: Kolosal remains the most responsive engine under both light and heavy load.
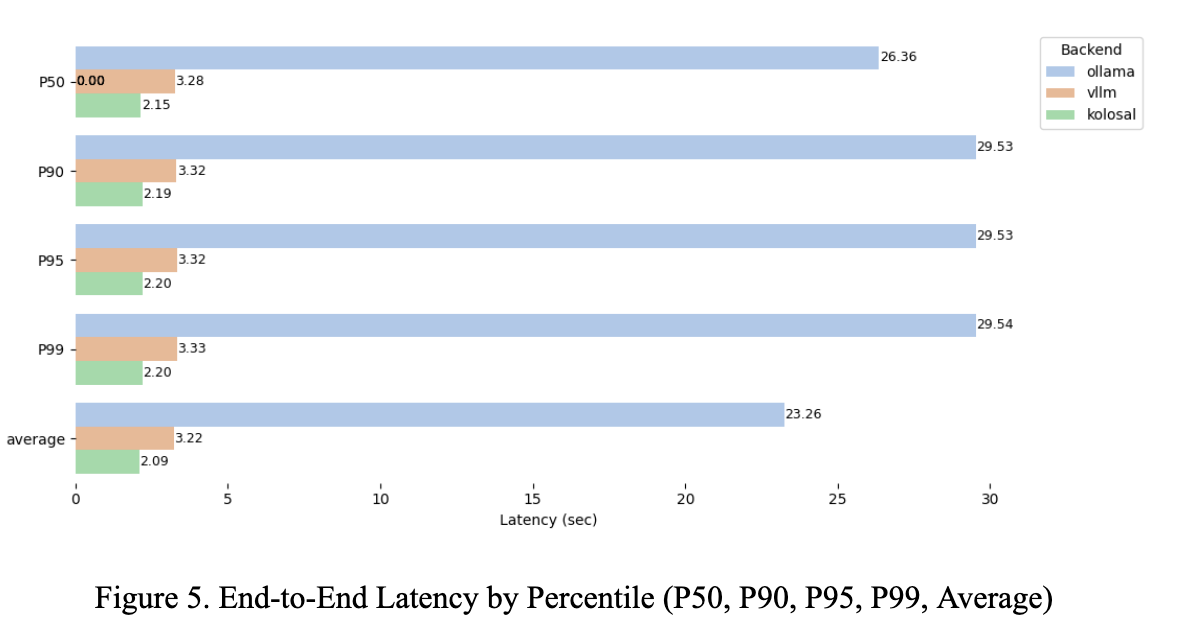
Kolosal records the lowest latency at every percentile: P50 2.15 s, P90 2.19 s, P95 2.20 s, P99 2.20 s, with a mean of 2.09 s. Compared with vLLM (P50 3.28 s, P90 3.32 s, P99 3.33 s, mean 3.22 s), this is ~1.5× faster (≈34–35% lower) across percentiles. Against Ollama (P50 26.36 s, P90 29.53 s, P99 29.54 s, mean 23.26 s), Kolosal is 11–13× faster (≈91–93% lower). Tail latency is tight for Kolosal (0.05 s from P50→P99) versus >3 s for Ollama. Net: Kolosal delivers consistently lower and more predictable latency.
Summary
| Metric | vs vLLM | vs Ollama |
|---|---|---|
| Requests per Second (RPS) | 1.55× faster (+54.5%) | 9.94× faster (+893.7%) |
| Tokens/s (average) | 1.70× faster (+70.5%) | 9.88× faster (+888.1%) |
| Tokens/s @ 32 concurrency | 1.60× faster (+60.5%) | 15.81× faster (+1,481%) |
| Tokens/s @ 64 concurrency | 1.71× faster (+71.5%) | 22.46× faster (+2,146%) |
| Time to First Token (TTFT), range | 2–4× faster (50–73% lower) | 11–870× faster (90–99.9% lower) |
| TTFT @ 32 concurrency | 3.7× faster (−72.7%) | — |
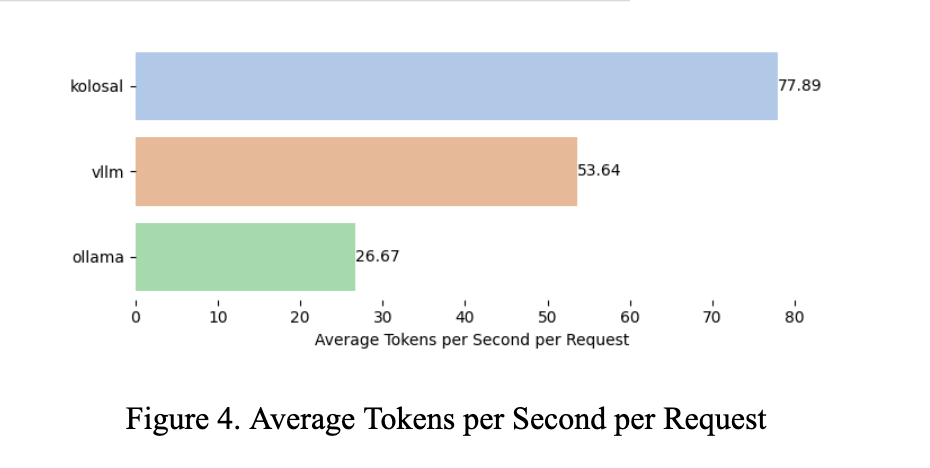
| Avg tokens/s per request | 1.45× faster (+45.2%) | 2.92× faster (+192.1%) |
| End-to-end latency, Avg | 1.54× faster (−35.1%) | 11.1× faster (−91.0%) |
| End-to-end latency, P50 | 1.52× faster (−34.5%) | 12.3× faster (−91.8%) |
| End-to-end latency, P99 | 1.51× faster (−33.9%) | 13.4× faster (−92.6%) |
Across all benchmarks, Kolosal leads by substantial margins. Versus vLLM, throughput (RPS and tokens/s) is ~1.5–1.7× higher, with 35–70% lower latency and time to first token (TTFT). Versus Ollama, throughput is ~10–22× higher, per-request speed is nearly 3× faster, and responsiveness/latency is ~11–870× better depending on concurrency. Overall, Kolosal scales more effectively, responds faster, and sustains more predictable performance under load than both vLLM and Ollama.